

An engagement rate only becomes useful when you state what you counted and what you divided it by. The same post can have several valid percentages. They answer different questions, so comparing them without a label can lead to the wrong conclusion.
This guide explains three common calculations using hypothetical numbers. It does not set a universal target or claim that a particular percentage guarantees reach, sales or account growth.
Define the interactions first
Decide which actions belong in your numerator. For a post you own, you might use likes, comments, saves and shares where those metrics are available. For a public competitor comparison, you may only have likes and comments. Label that narrower calculation honestly; do not assume that unavailable saves or shares are zero.
Interaction totals are not necessarily unique people. One person can perform more than one action. Therefore, a rate based on total interactions should not be described as the percentage of people who engaged unless your numerator actually measures distinct accounts.
Choose the denominator that matches your question
| Calculation | Formula | Question it helps answer |
|---|---|---|
| By followers | Interactions ÷ followers × 100 | How large is this post’s interaction total relative to the account’s follower base? |
| By reach | Interactions ÷ accounts reached × 100 | How much interaction occurred relative to the audience reached? |
| By views | Interactions ÷ views × 100 | How much interaction occurred relative to the measured video views? |
Use the metric definitions and reporting period shown in the platform’s analytics. Views and reach are not interchangeable. If the denominator is zero or unavailable, report the rate as not available rather than forcing a percentage.
A worked example: one post, three rates
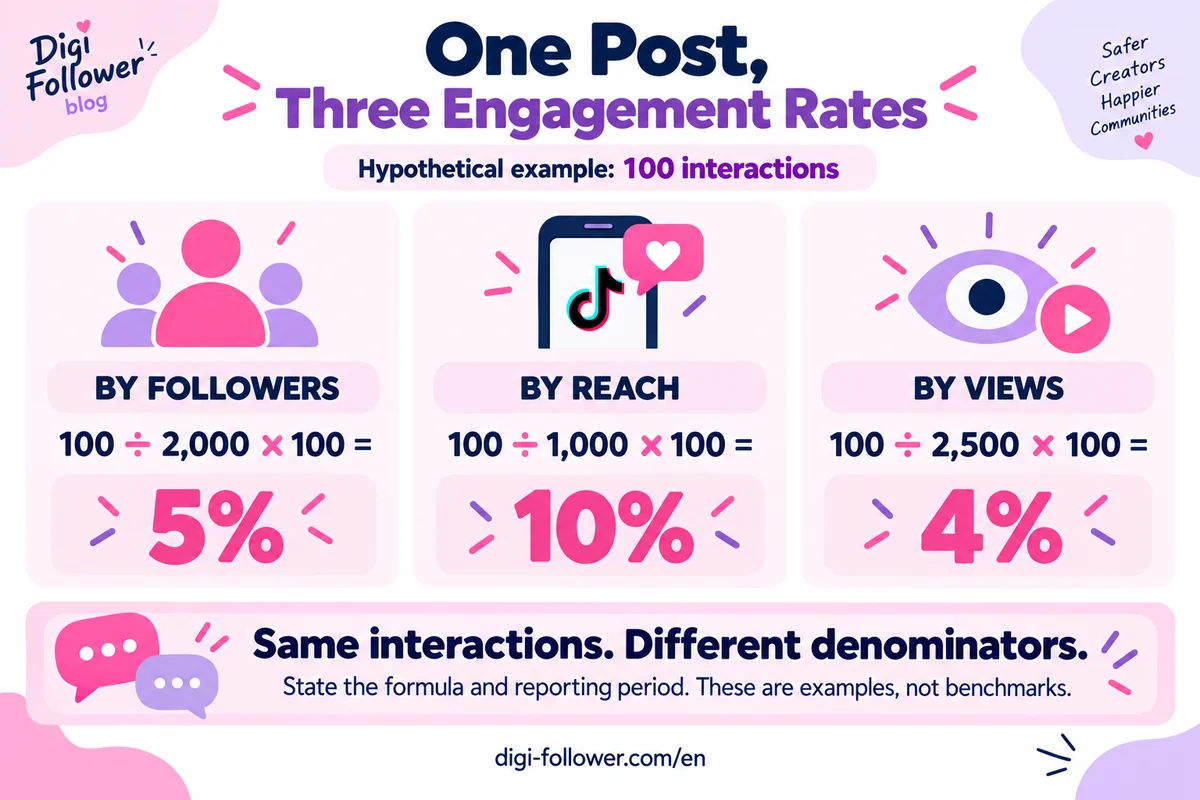
Imagine a post with 80 likes, 10 comments, 5 saves and 5 shares. Its interaction total is 100. The account has 2,000 followers, the post reached 1,000 accounts and its video recorded 2,500 views.
- By followers: 100 ÷ 2,000 × 100 = 5%.
- By reach: 100 ÷ 1,000 × 100 = 10%.
- By views: 100 ÷ 2,500 × 100 = 4%.
None of these values contradicts the others. The denominator changed. Write “10% interaction rate by reach, including likes, comments, saves and shares” instead of reporting an unexplained “10% engagement.” These numbers are a teaching example, not a benchmark for your account.
Build a comparison you can repeat
- Choose comparable posts. Group similar formats and objectives instead of mixing a product announcement, a giveaway and a tutorial into one verdict.
- Use the same observation window. Compare each post after the same amount of time, rather than a new upload against a month-old post.
- Keep the numerator consistent. Do not include saves for one post and omit them for another without clearly separating the results.
- Record the denominator. If using followers, note when that count was captured.
- Keep the raw numbers. A percentage without its counts hides the size of the observation.
Average rates and pooled rates are different
Suppose post A has 10 interactions from 100 accounts reached, or 10%. Post B has 20 interactions from 1,000 accounts reached, or 2%. The simple average of the two post rates is 6%. The pooled calculation is 30 ÷ 1,100 × 100, approximately 2.73%.
The first treats each post equally; the second weights by the reported reach totals. State which method you use. Summing post-level reach does not produce a unique account-level audience because the same person may see both posts. Do not label that sum as distinct people across the whole campaign.
What is a good engagement rate?
There is no single number that answers that question for every format, audience size and goal. Start with your own comparable posts using a consistent formula. Look for changes that repeat across several posts, then inspect the content and audience context.
A high rate from a small audience can still produce fewer useful enquiries than a lower rate from a larger relevant audience. For a sales campaign, also record purchases or qualified enquiries. For educational content, inspect the actual questions and responses. Treat the percentage as one measurement, not a complete performance verdict.
Turn the calculation into one useful experiment
If similar tutorials earn saves but few questions, try ending the next tutorial with one specific question about the difficult step. Record the hypothesis before publishing, then compare the same metrics after the same window. Avoid changing the topic, format and audience all at once if you want to understand the result.
For more context around planning content and reviewing account activity, explore our Instagram guides. Keep service delivery counts separate from organic-content results when preparing a report.
Frequently asked questions
Can I compare my rate with a competitor’s?
Only with clearly matched formulas and available data. Public likes and comments omit private metrics such as saves; label the limited comparison accordingly.
Does a larger follower count automatically improve the rate?
No. With the same interactions, a larger follower denominator makes a follower-based rate smaller. That arithmetic says nothing by itself about content quality.
Can interaction rate by reach exceed 100%?
Mathematically, yes, when interactions exceed accounts reached. Multiple actions per account are possible. Check the definitions and raw data before assuming an error.